
Quarterly updates
FarmOnline+ is continuously improved to support more efficient and reliable farm management. On this page, we share the latest updates, enhancements, and new features—designed to make everyday tasks easier, improve system performance, and deliver even more value from your FarmOnline+ solution.
🌍 Want to read this in your own language? No problem! Use your web browser’s built‑in Translate feature to view the FarmOnline+ release notes in your preferred language.
FarmOnline+ release summary
Farm Online+ Q1 2026 introduces the new Batches app, improving the foundation for consistent and reliable data comparison across production sites. Trend Warnings are now included in the broiler main package, giving users earlier insight into deviations and performance risks. The mobile app has been enhanced with Remote Access to all accessible locations and alarm units directly from the app.
Survey, Analytics, and Boards received multiple usability improvements, including deeper graph zoom, sensor-level views, new widgets, and clearer operational context. The release also includes improved task handling, enhanced alarm management, and a Datalink update with broader hardware support, stability, security, and language improvements.
 General updates
New app - BATCHES
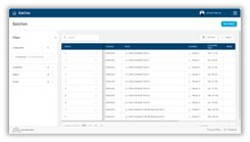
Optimize your data comparison foundation for rock-solid data. The new Batches app keeps your data tidy by organizing the batch/flock/groups across many different pieces of underlying equipment we support.
Broiler package - Trend Warnings added - catch problems early
 Before it was a standalone feature, but now the powerful broiler Trend Warnings is included in the main package.
Trend Warnings delivers on our promise of having the system look out for you, rather than you looking out for the system.
You now catch underlying issues early with easy-to-implement resolutions to keep you on track.
New language - Traditional Chinese
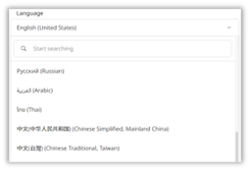
It is now possible to use the platform in Traditional Chinese.
 Mobile app (FarmOnline+) - New features
Remote access - Access Alarm, Datalink, Vison computer, etc.
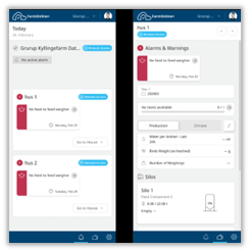
You can now remotely access all locations you have permissions for. For example, Alarm Units can be reached remotely, expanding beyond the previous capability that allowed only Controller access.
 Survey
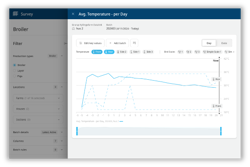
Graph - More granular zoom
You can now use the bar at the bottom of analytics to zoom in to less than a day in the graph.
This helps you perform a detailed root-cause analysis of issues in your production environment.
Get Started Tour - New step
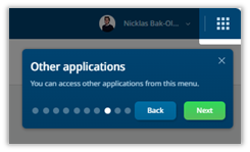
The Get Started Tour now includes the Application Switcher to inform users about other available applications.
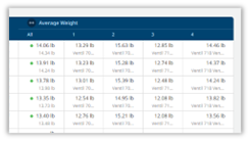
Graphs - Filter buttons - Data from individual sensors
When data is from multiple sensors, the filter buttons appear.
This feature helps you gain more detailed information about the environment and underlying equipment.
Example in broiler management, you can now see individual average weight readings per bird weigher.

Batch overview - Extend button - data from individual sensor
This feature provides more detailed information about the environment and the equipment underlying it. For example, in ProGrow, this allows you to view average weight readings for each camera individually.

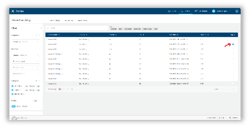
Main table - Extend button - data from individual sensors
 This feature provides more detailed information about the environment and the underlying equipment. For example, in ProGrow, it allows you to see individual average weight readings per camera.
![]()
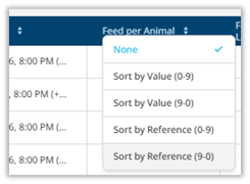
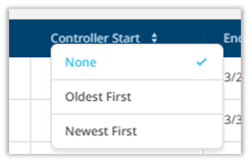
Main table - Improved sorting logic
We eliminated the option to sort by reference in the table when the key value does not support references.
Performance overview - Production day display
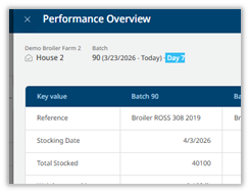
We have included the production day in both Performance Overview and Batch Overview to provide additional context.
 Boards
Widgets - New Alarm widget
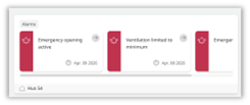
You can now add an Alarm widget to your boards. This widget provides a convenient overview of alarms from a specific location. It also allows you to open an alarm to view its context for quick insights.
Widgets - New Silo widget
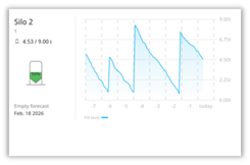
 You can now add a Silo widget to your boards to display one or multiple silos. When displayed individually, the silo is shown with a fill level graph. When showing several silos, the widget displays multiple silos with essential information for each. Additionally, the widget lets you open an alarm to quickly view its context and gain better insight.
Widgets - New Text widget
 This can generate headlines that improve readability from a distance. You can now organize your Boards more effectively to maintain a clear overview of various aspects.
Widgets - Display where house data comes from
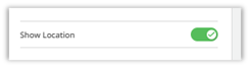

You can now toggle 'Show Location' when creating or editing a widget, allowing the selected location to be displayed. This improvement helps you better track the source of data within your operation.
Get Started Tour - New step
The Application Switcher has been included in the Get Started Tour to inform users about additional applications.
 Analytics
Graph - More granular zoom

You can now use the bar at the bottom of Analytics to zoom in to less than a day on the graph. This helps you perform detailed root-cause analysis of issues in your production environment.
Get Started Tour - New step
The Application Switcher has been included in the Get Started Tour to ensure users are clearly aware of other applications.
 Alarm
Alarm
Alarm - Overview - Ability to invalidate alarm
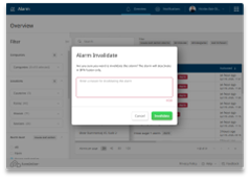
You can now eliminate irrelevant alarms to concentrate on what truly matters in your production.
 Export
Overview - Partner - Push data on create (KiK/Acqp)
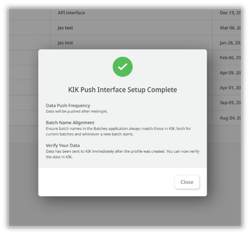
Data is now submitted immediately after configuring the partner integration for KiK and Acqp. This allows service technicians to set up and complete the solution on the same day, with instant verification available in the external interface.
 Silo
Silo
Overview - Table - Improved with new UI
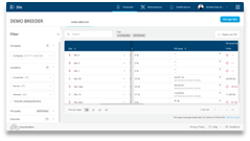
The table view in Silo now matches the latest table design, offering a more user-friendly appearance.
 Datalink 2.15.1
Device
Supports i.MX8 CPU, Enhanced self-diagnostics, Improved security features, Supports 10 additional languages
Controller gateway
Energy meter data support (1-2 meters)
3 new ventilation parameters: NORMAL_MAXIMUM_VENTILATION, MAXIMUM_VENTILATION_SETPOINT, MAXIMUM_INSTALLED_VENTILATION
Correction of extra offline controllers, Remote access stability improvements
Sensor gateway mode
Calibration procedure for the DOL 18 pressure sensor
Preview features
The features listed below are in preview. Contact us to become an early access customer and gain access to new preview features.
 Tasks (part of subscription)
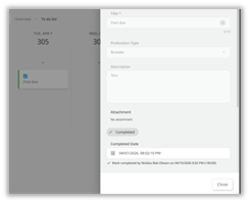
Overview - To-do list - Complete task in the past
Template - Calendar day templates
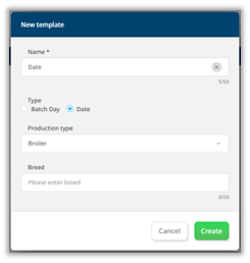
It is now possible to create templates that automate tasks based on calendar dates rather than batch days.
This enables tasks that are not directly tied to the animal's age; for production that runs more continuously, tasks by calendar data might make more sense.
Note: multiple templates can be set up for a location/house.
Overview - Set planned stocking date (batch start)
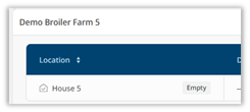
 It is now possible to set the planned stocking date, allowing you to plan batch tasks without having to start a batch on the controller early.
 Monitor (add-on + hardware)
Distribution - Recent distribution
 Heatmaps of distribution are now available from day 0, whereas previously they only appeared from day 10 onwards. These early heatmaps help maintain consistent production during the crucial initial days of the batch.
Distribution - Batch distribution
 It is possible to see distribution graphs from day 3 and onward. The early distribution gives a more complete picture of the production.
Activity - Recent activity - Dialog
 It is now possible to Tag an activity event of interest for later evaluation.
Activity - Recent activity - Table
You can now view Tagged activities, making it easier to find specific ones.
Feature deprecation
The features below were removed during this period. We work tirelessly to improve our platform, including removing unused or replaced features. If any of the feature removals below cause concern, please reach out to service@skov.dk
Trend Warnings - Removed Feed Change input
 Feed change functionality has been deprecated as we pursue a more integrated feed change capability.
Closing
That concludes the Q1 updates! We hope these enhancements make your daily work in FarmOnline+ smoother and more enjoyable to explore. As always, feel free to contact our global team, who will be happy to guide you through the new features.